Causal Loop Diagram
Causal Loop Diagramming (CLD) is a business analysis tool.
It helps users to understand cause-and-effect relationships in complex systems.
Key concepts important in CLD include:
System: A complex network of interconnected elements or components that influence each other’s behaviour, such as an ecosystem
Example: In an agricultural system the interactions between farming practices, crop type, and soil nutrients can impact outcomes like profits.
Target factors: Specific aspects within the system that can be the focus of analysis or intervention
Example: Increasing how much can be harvested per acre may be a key target factor for farmers wanting to increase profits
Related factors: Other aspects within the system that directly or indirectly influence the target factors
Example: How farmers manage pests is a related factor which impacts crop yield
Relationships: The connections between different factors within the system
Example: Applying fertiliser increases soil nutrient, leading to improved crop growth
Feedback loops / cycles: Patterns of interactions between factors, where a change feeds back into the system and can reinforce outcomes (positive or negative).
Example: When soil nutrients are low, crop yields will be lower, which can further accelerate soil erosion. So if the nutrients are not improved it can create a cycle where results get worse over time.
Leverage points: Areas within the system where changes can have significant impact.
Example: Introducing a government policy that incentivises sustainable agricultural practices
The results
- A visual representation of the current system and its dynamics
- A deeper understanding of the system
- Identification of key leverage points
- Insights into potential consequences of decisions or actions
When to use it
Systems Thinking: When seeking to understand and influence complex systems
Problem Solving: When seeking to identify root causes of problems in complex systems
Policy Analysis: When evaluating the potential impacts of policy changes

Strengths
Holistic
Captures evolving systems well
Focused on root causes

Weaknesses
Can be complex
Subjective
Time consuming
How to use it?
What do I need to start?
A problem or key question to focus on.
Information on the system, such as:
-
- Historical data including past events and their impacts across the system
- Direct insights including input from people with firsthand knowledge of the system
- Secondary insights including industry reports which indicate how relationships within the system are changing
How to use it?
Who to involve?
Causal loop diagramming is best done with a team. Consider including:
- People directly affected by the system or planned changes
- Subject matter experts who can give insights on the relationships within the system
Step by step
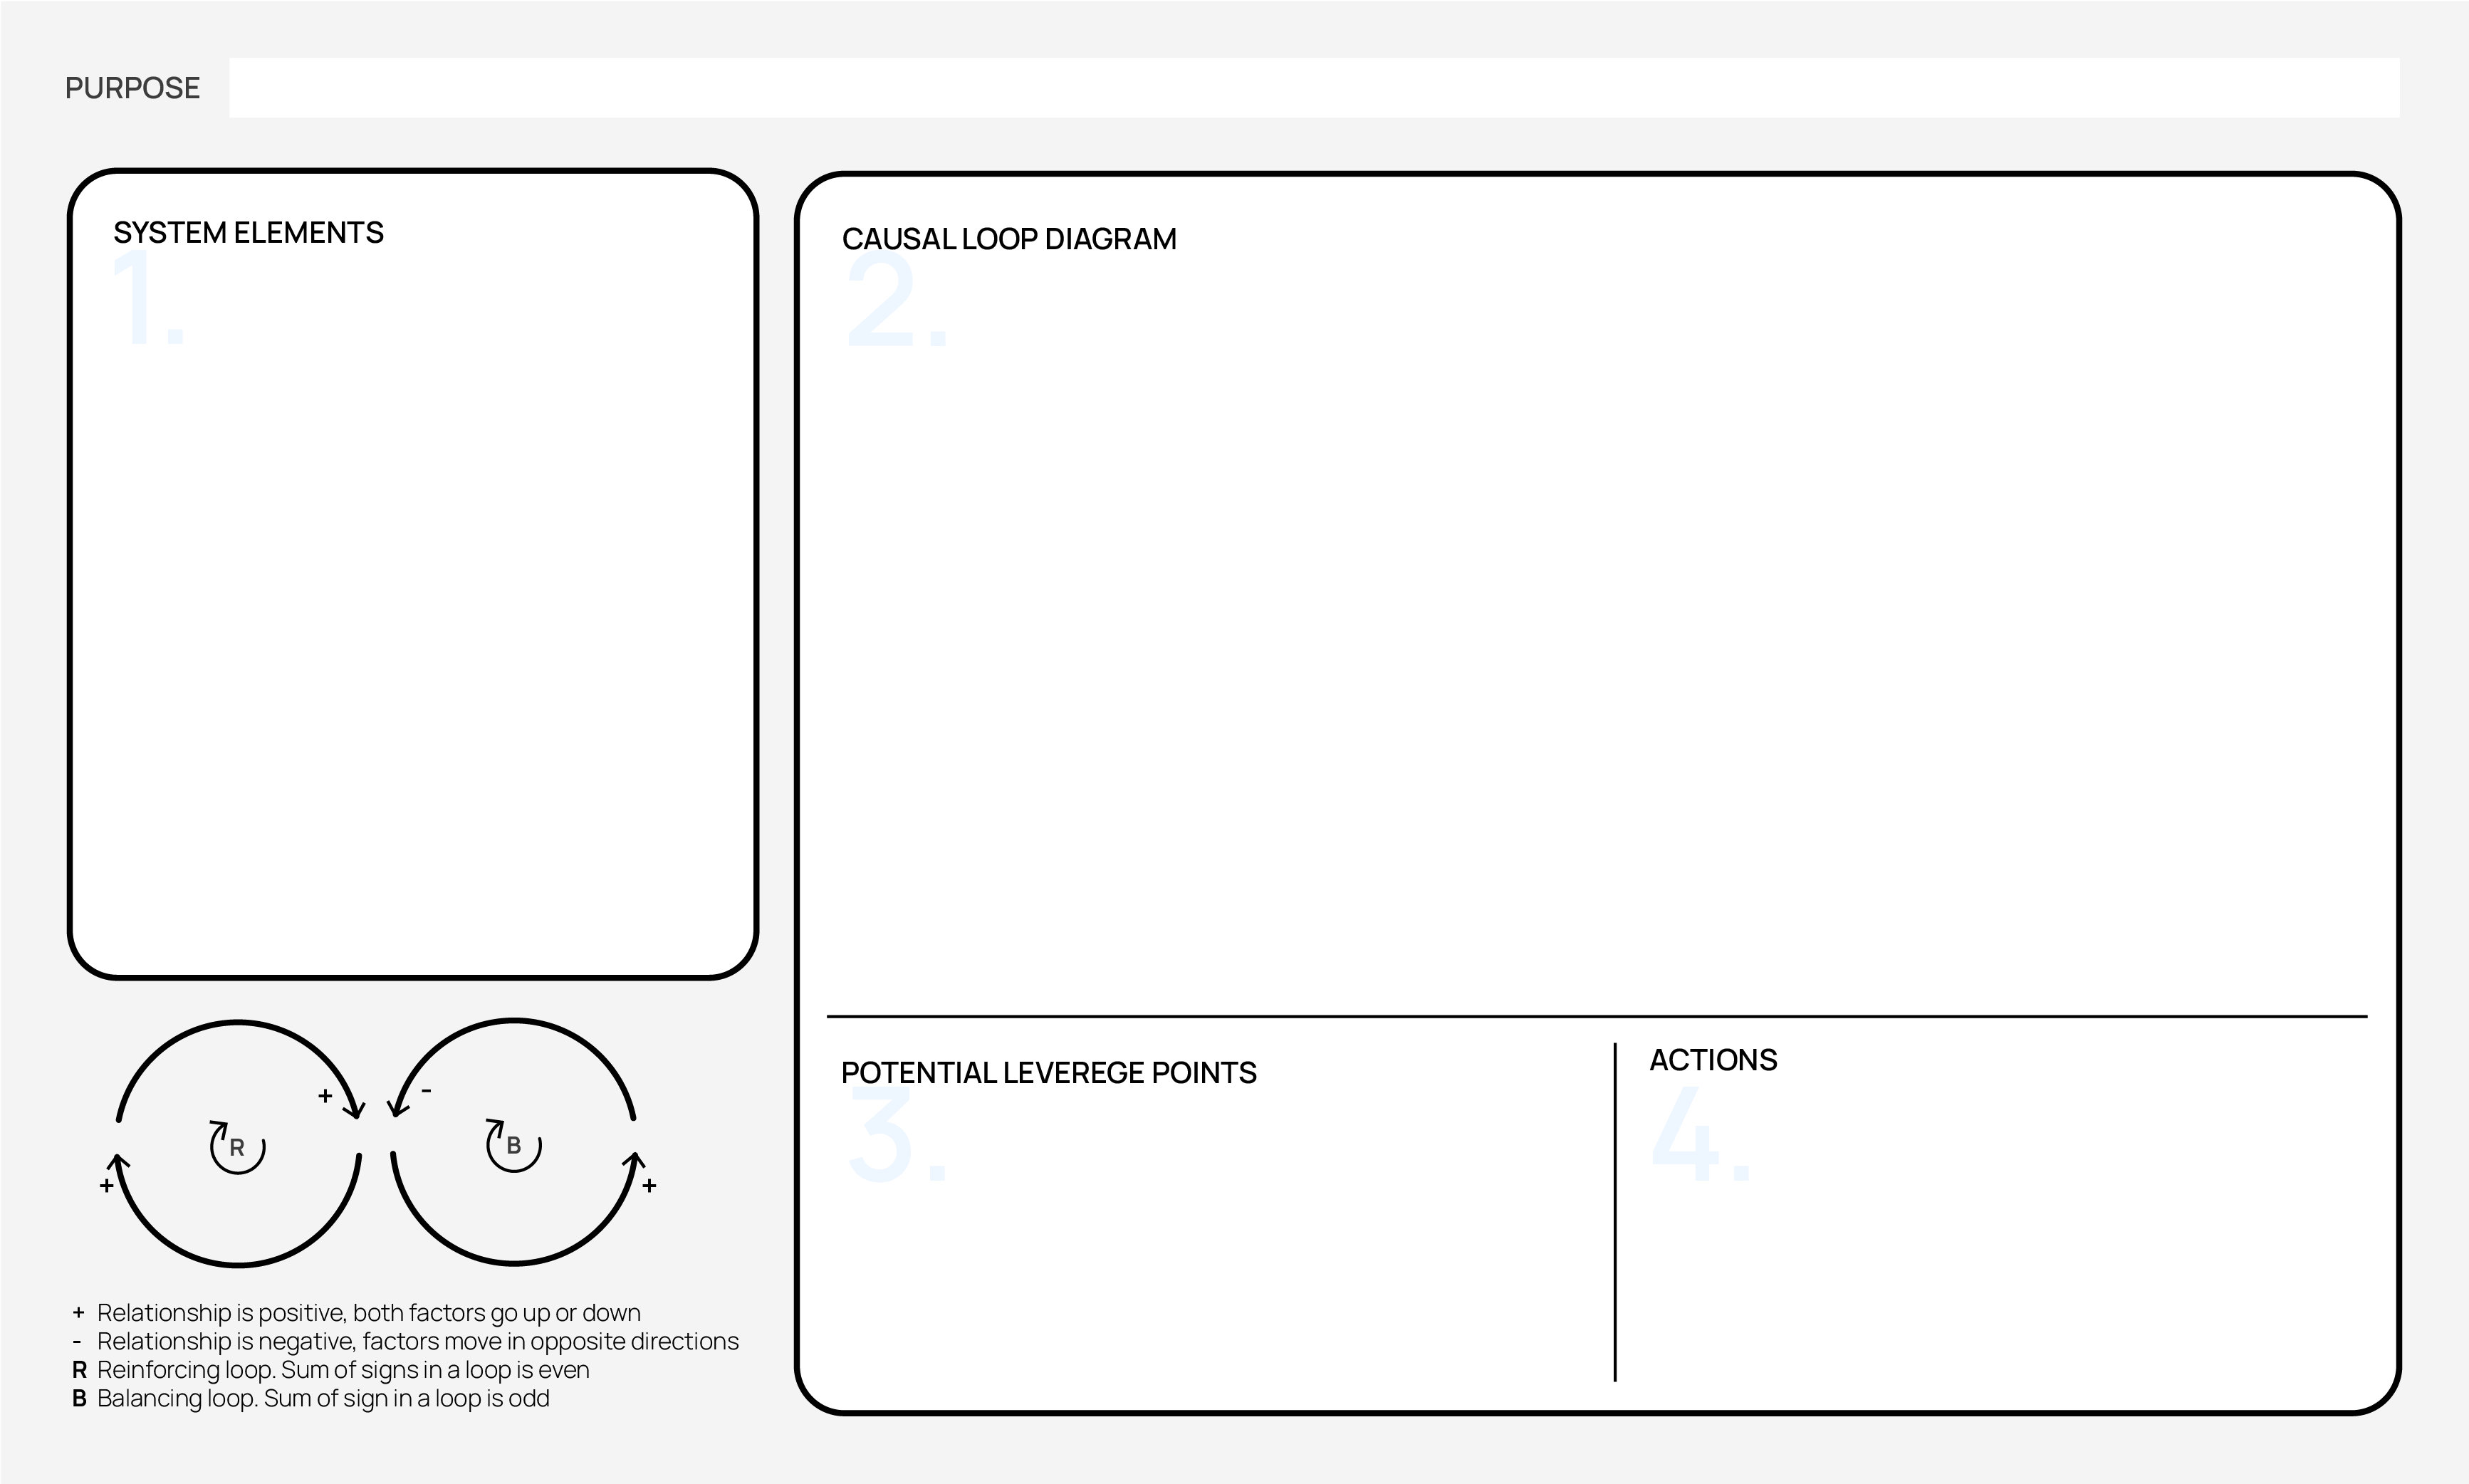
1
Define the purpose
The purpose may be a problem, an outcome or a key question the CLD will help to answer.
2
Identify the system elements
- Identify key target factors.
- Identify related factors.
- Add target factors and related factors to a canvas. Space them out with room to draw arrows between each.
3
Determine relationships
Draw arrows to show how factors affect each other.
Put a ‘+’ if the relationship is positive, meaning both things move in the same direction – both go up or both go down. Put a ‘-’ if the relationship is negative, so things move in opposite directions. For example:
- Increased rainfall increases crop yield (+)
- Increased pesticide use decreases pest populations (-)
- Decreased rainfall decreases soil moisture (+)
4
Identify and assess feedback loops
Look for patterns where factors are connected and draw loops which come back to the target factor within the system.
Loops can be reinforcing (amplifying) or balancing (stabilising). For example:
-
- Reinforcing: Planting more crops leaves more residue in the field after harvest, which improves soil fertility. Better soil fertility leads to higher crop yields, encouraging farmers to plant even more crops the next season.
- Balancing: Using more irrigation water leads to higher crop yields. However, higher water usage depletes water resources, which forces farmers to reduce irrigation to conserve water.
To assess whether a loop os reinforcing or balancing, sum the positive (+) and negative (-) signs within a loop:
-
- If the sum of the signs is even, the loop is reinforcing.
- If the sum of the signs is odd, the loop is balancing.
5
Analyse and identify leverage points
Identify potential leverage points. Consider how leverage points might be used to achieve better outcomes.
Analyse and refine the feedback loops to understand how changes to each leverage point may lead to reinforcing or balancing outcomes.
Consider which leverage points may have the greatest impact and draft potential actions.