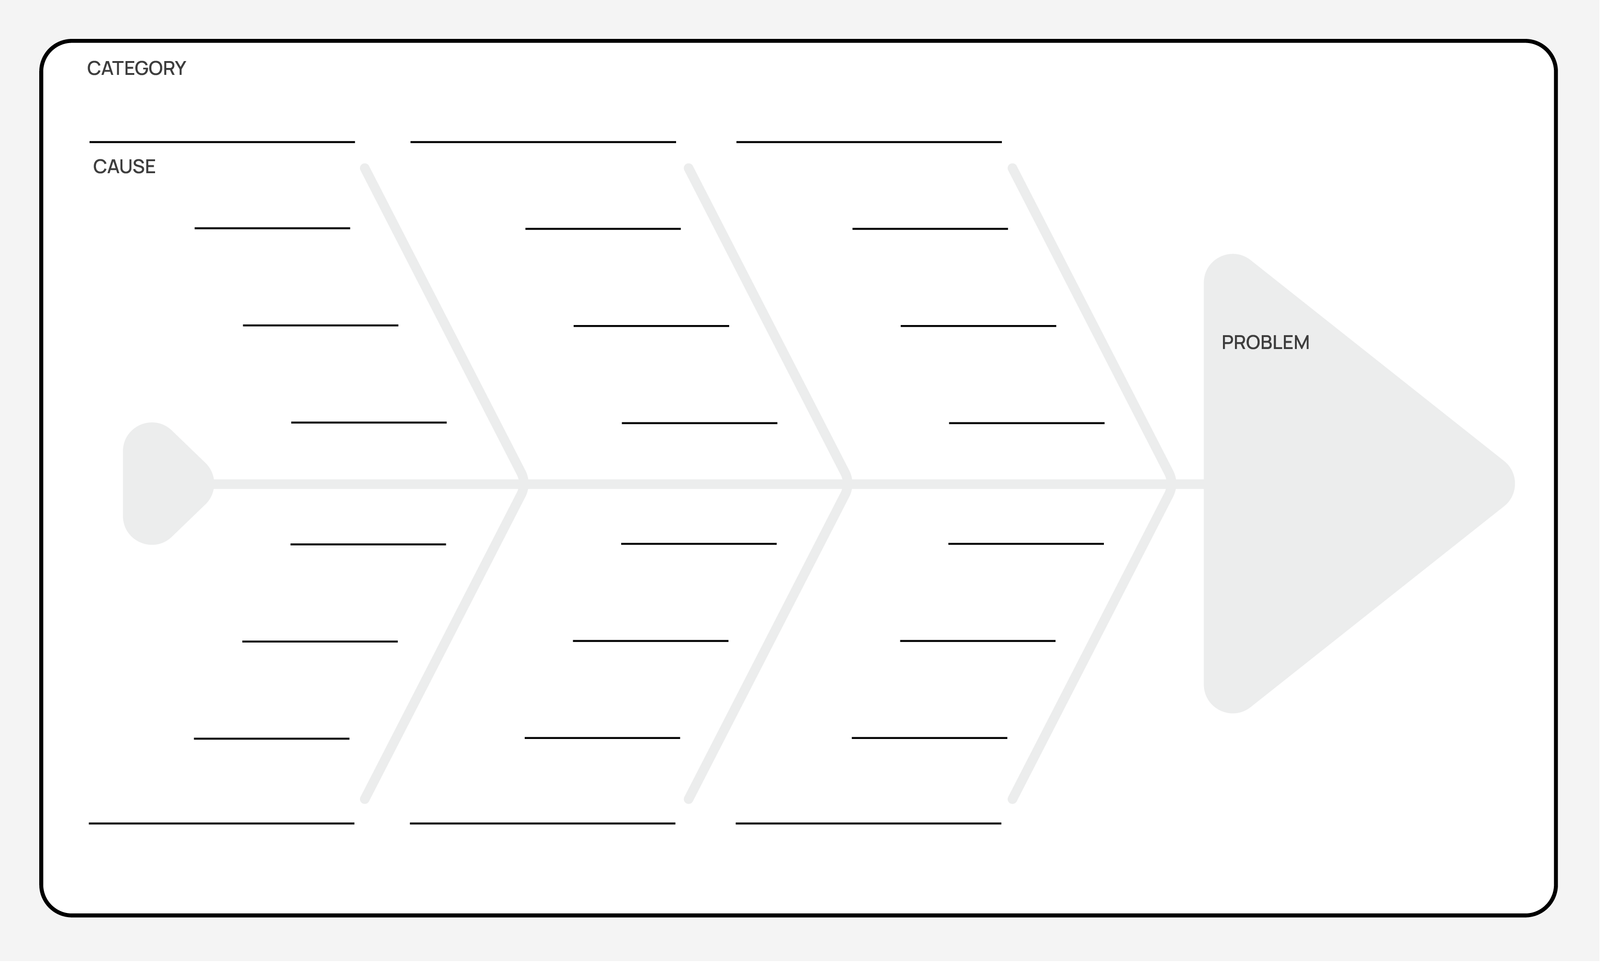
Fishbone/ Ishikawa
The Ishikawa diagram is a visual tool used to identify root causes of organisational or process problems. It is also known as the Fishbone diagram or the Cause and Effect diagram.
The Ishikawa method visually maps out causes of a problem in categories. Commonly used categories include:
6 M’s
These categories are often used in manufacturing and engineering to explore the causes of defects or issues:
Manpower: Problems related to staff, like skills, training, or workload.
Machines: Issues with equipment or technology, including maintenance, age, or capacity.
Materials: Problems with the raw materials, such as quality or availability.
Measurement: Accuracy and reliability of data collection and control processes.
Mother Nature: Environmental factors, like weather or natural events.
Method: The processes or procedures being followed and their effectiveness.
8 P’s
These categories are often used in marketing and services to diagnose issues affecting customer satisfaction or business performance:
Procedures: The standard ways of doing things that might be causing problems.
Policies: Organisational rules or policies that could be causing delays or confusion.
Place: Location factors, including geography or the physical setup.
Product: Issues with the product itself, like quality or design.
People: Human factors, including customer interactions or staff behaviour.
Processes: The overall processes in place and how they could be improved.
Price: Pricing strategies and their impact on sales or profits.
Promotion: Marketing efforts that might affect how the product is seen or sold.
4 S’s
These categories are often used in service and supply chain contexts to spot inefficiencies:
Suppliers: Issues with suppliers, such as reliability or delivery times.
Systems: Technology or software that supports operations and may need updating.
Surroundings: The physical environment that might affect outcomes.
Skills: The capabilities and training of the workforce.
The results
- A shared understanding of the problem
- A visual representation of potential causes
- Prioritised root causes
- Prioritised actions
When to use it
Problem Solving: When trying to identify the root causes of a specific problem or issue within a process or system
Quality Improvement: When aiming to improve the quality of products or services by identifying and addressing underlying factors contributing to defects or errors

Strengths
Simple
Visual
Collaborative
Encourages different perspectives
Result helps communicate logic

Weaknesses
Not friendly to quantitative analysis
Subjective
Can lead to oversimplification
Time consuming for large scale problems
Can overlook relationships between causes
How to use it?
What do I need to start?
- A problem
- Information on the identified problem. For example customer feedback, employee observations, performance metrics
- Information on similar or possibly connected problems
How to use it?
Who to involve?
- People with knowledge or experience relevant to the problem
- Representatives from different teams or departments that are impacted by the problem
- A person who guides and facilitates the discussion
Step by step
1
Define the problem (the fish head and spine)
Write the problem at the ‘head’ of the fish and draw a horizontal line for a ‘spine.’
2
Choose and label major categories (the fish bones)
Choose relevant categories of potential causes, such as people, policies, processes and place. Draw a diagonal line (bone) branching off from the spine for each category.
3
Brainstorm possible causes (the fish ribs)
Dive deeper into each category, identifying potential causes of the problem. Add one rib per cause and keep descriptions to less than 10 words.
4
Analyse further
Under each cause, think deeper and list specific details or reasons contributing to this cause. Using the 5 Whys is helpful to surface deeper causes.
5
Prioritise
Choose causes most likely to have the most significant impact if addressed. Decide what further evidence and validation is required before decision makers will allocate resources to taking action.
6
Take action
After validation activities confirm or surface the most impactful causes, define an intervention plan with relevant success metrics to solve the problem and allocate resources.